
A Statistical Analysis of Immigration and Population Growth Effects on Canadian Housing Prices
Published:
Preparation to run codes
Repo is in private. Please contact (jaechoi.dev@gmail.com) for more information.
conda create --name cmpt353-jca589
conda activate cmpt353-jca589
conda install --file requirements.txt
python run.py --raw # this downloads raw datafiles
python run.py # this analyze using processed data
0. Summary
This project analyzes the relationship between immigration patterns and real estate price growth in Canada from 2006-2024. First, I will explore population data to examine the relationship between immigrants and the population in Canada by province. By analyzing population growth components such as births, deaths, influx and outflux, I will attempt to develop hypotheses about the impact of immigrants on urbanization and increasing real estate prices in Canada. These hypotheses will be examined using both statistical analysis and machine learning techniques including Random Forest, K-means clustering, and PCA. The results may have limitations due to the lack of long-term immigration data, my limited economics background and data analysis experience, but this could demonstrate that immigration’s impact is complex and requires multiple perspectives.
1. Defining Questions
1.1 Context
Canada has been recognized as a nation of immigrants. Immigrants have consistently comprised a significant portion of Canada’s population. However, the aggressive immigration policies of the past decade have been cited as a cause of various social issues, including rising real estate prices. This project examines data on Canada’s population growth and immigration increases, exploring the correlation with rising real estate prices as a prominent social issue. The analysis aims to interpret the significance of this relationship.
1.2 Questions
- Has immigration accelerated Canadian urbanization?
- Does immigration directly cause real estate price increases?
- Is urban concentration the key mechanism linking immigration to housing prices?
2. Data Cleaning and Preparation
2.1 Data Collection
- Population estimates, quaterly,1946-2025 (Statistics Canada)
- Population estimates, July 1, by census metropolitan area and census agglomeration,2001-2024 (Statistics Canada)
- Estimates of the components of demographic growth, annual (Statistics Canada) : 1972-2024
- Canada - Permanent Residents by Province/Territory and Census Metropolitan Area (CMA) (open.canada.ca)
- Canada - Admissions of Permanent Residents by Province/Territory and Census Metropolitan Area (CMA) of Intended Destination and Immigration Category, 2006 - April 2016 (open.canada.ca)
- Mobility of immigrant taxfilers by census metropolitan areas and tax year, 2012-2022 (Statistics Canada)
- New housing price index, monthly, 1981-2025 (Statistics Canada)
- Labour force characteristics by province, monthly, unadjusted for seasonality, 1977-2025 (Statistics Canada)
2.2 Data Cleaning and Preparations
Statistics Canada has tools to filter data before downloading CSV files. However, there are limitations in getting relevant data sometimes. So, I had to download complete CSV files for each topic and process only the columns I needed.
For Excel data, I manually cleared some rows and columns. All pre-processing was handled by individual Python files and generates processed data to data/processed.
Raw data is not available for upload on GitHub, so run.py has an option to download raw datasets to view the data processing steps. Otherwise, the analysis step uses processed data.
3. Data Analysis and Methods
3.1 Change of population components in Canada (between 1972 and 2024)
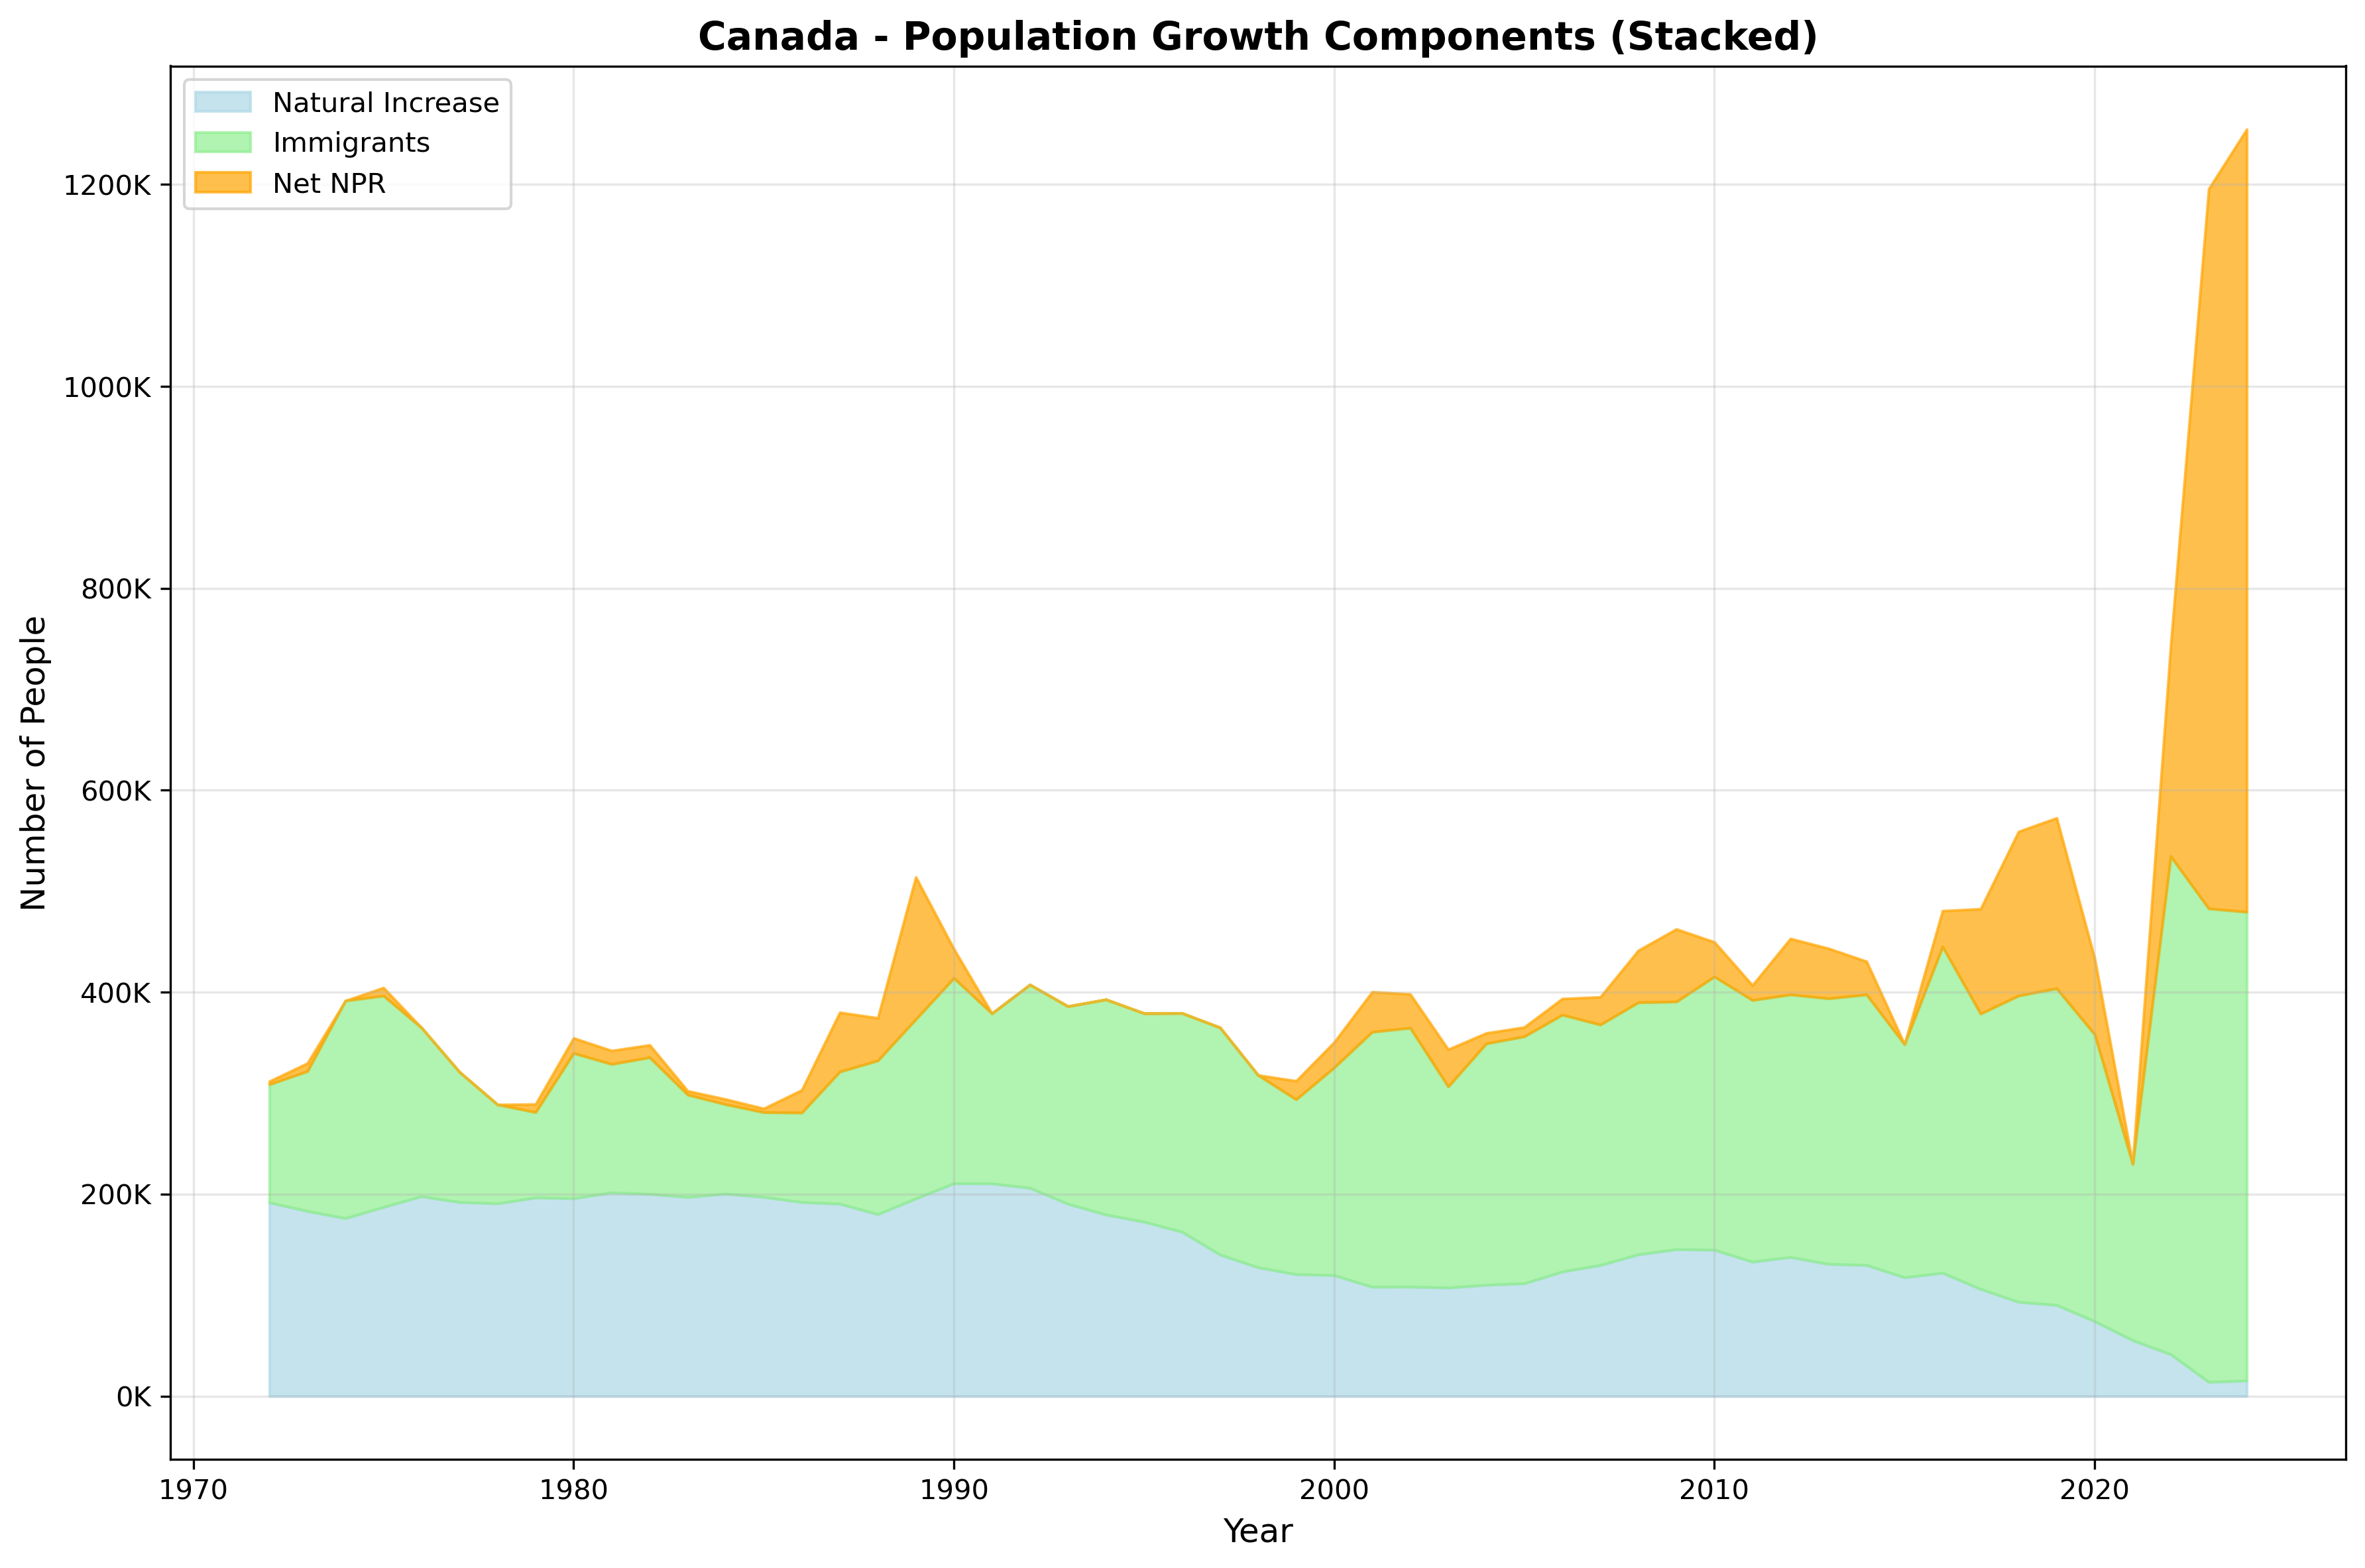
This stacked area chart shows Canada’s population growth components from 1972 to 2024. This shows that immigrants has been filling the gap from reduction of the natural increase.
- Light Blue (Natural Increase): Births minus deaths. This has been steadily declining from ~200K in the 1970s to near zero by 2024, reflecting Canada’s aging population and declining birth rates.
- Light Green (Immigrants): Number of permanent residents admitted annually. This shows the actual immigrant contribution, which gets reduced when NPR is negative. Generally increased from ~100-150K in the 1970s to ~250-500K in recent years.
- Orange (Net NPR): Net non-permanent residents (temporary workers, students, refugees). Only visible when positive.
3.2 Places to be chosen by immigrants in Canada
Retention Rate Statistics by Province (2012-2022)

| Province | Mean | Min | Max | Std | Trend |
|---|---|---|---|---|---|
| Ontario | 92.2 | 90.7 | 95.4 | 1.3 | Declining |
| Alberta | 92.0 | 89.1 | 96.4 | 2.4 | Declining |
| British Columbia | 87.8 | 85.3 | 92.9 | 2.3 | Declining |
| Quebec | 82.2 | 79.9 | 89.4 | 3.1 | Declining |
| Manitoba | 75.9 | 67.5 | 88.7 | 6.6 | Declining |
| Territories | 73.7 | 63.5 | 87.3 | 7.6 | Declining |
| Saskatchewan | 73.5 | 63.5 | 88.1 | 7.7 | Declining |
| Nova Scotia | 67.7 | 59.9 | 83.8 | 7.5 | Declining |
| Newfoundland and Labrador | 52.7 | 37.5 | 79.0 | 13.3 | Declining |
| New Brunswick | 51.1 | 38.3 | 76.6 | 12.5 | Declining |
| Prince Edward Island | 30.1 | 22.6 | 57.8 | 10.9 | Declining |
Correlation between Province GDP and the number of immigrants
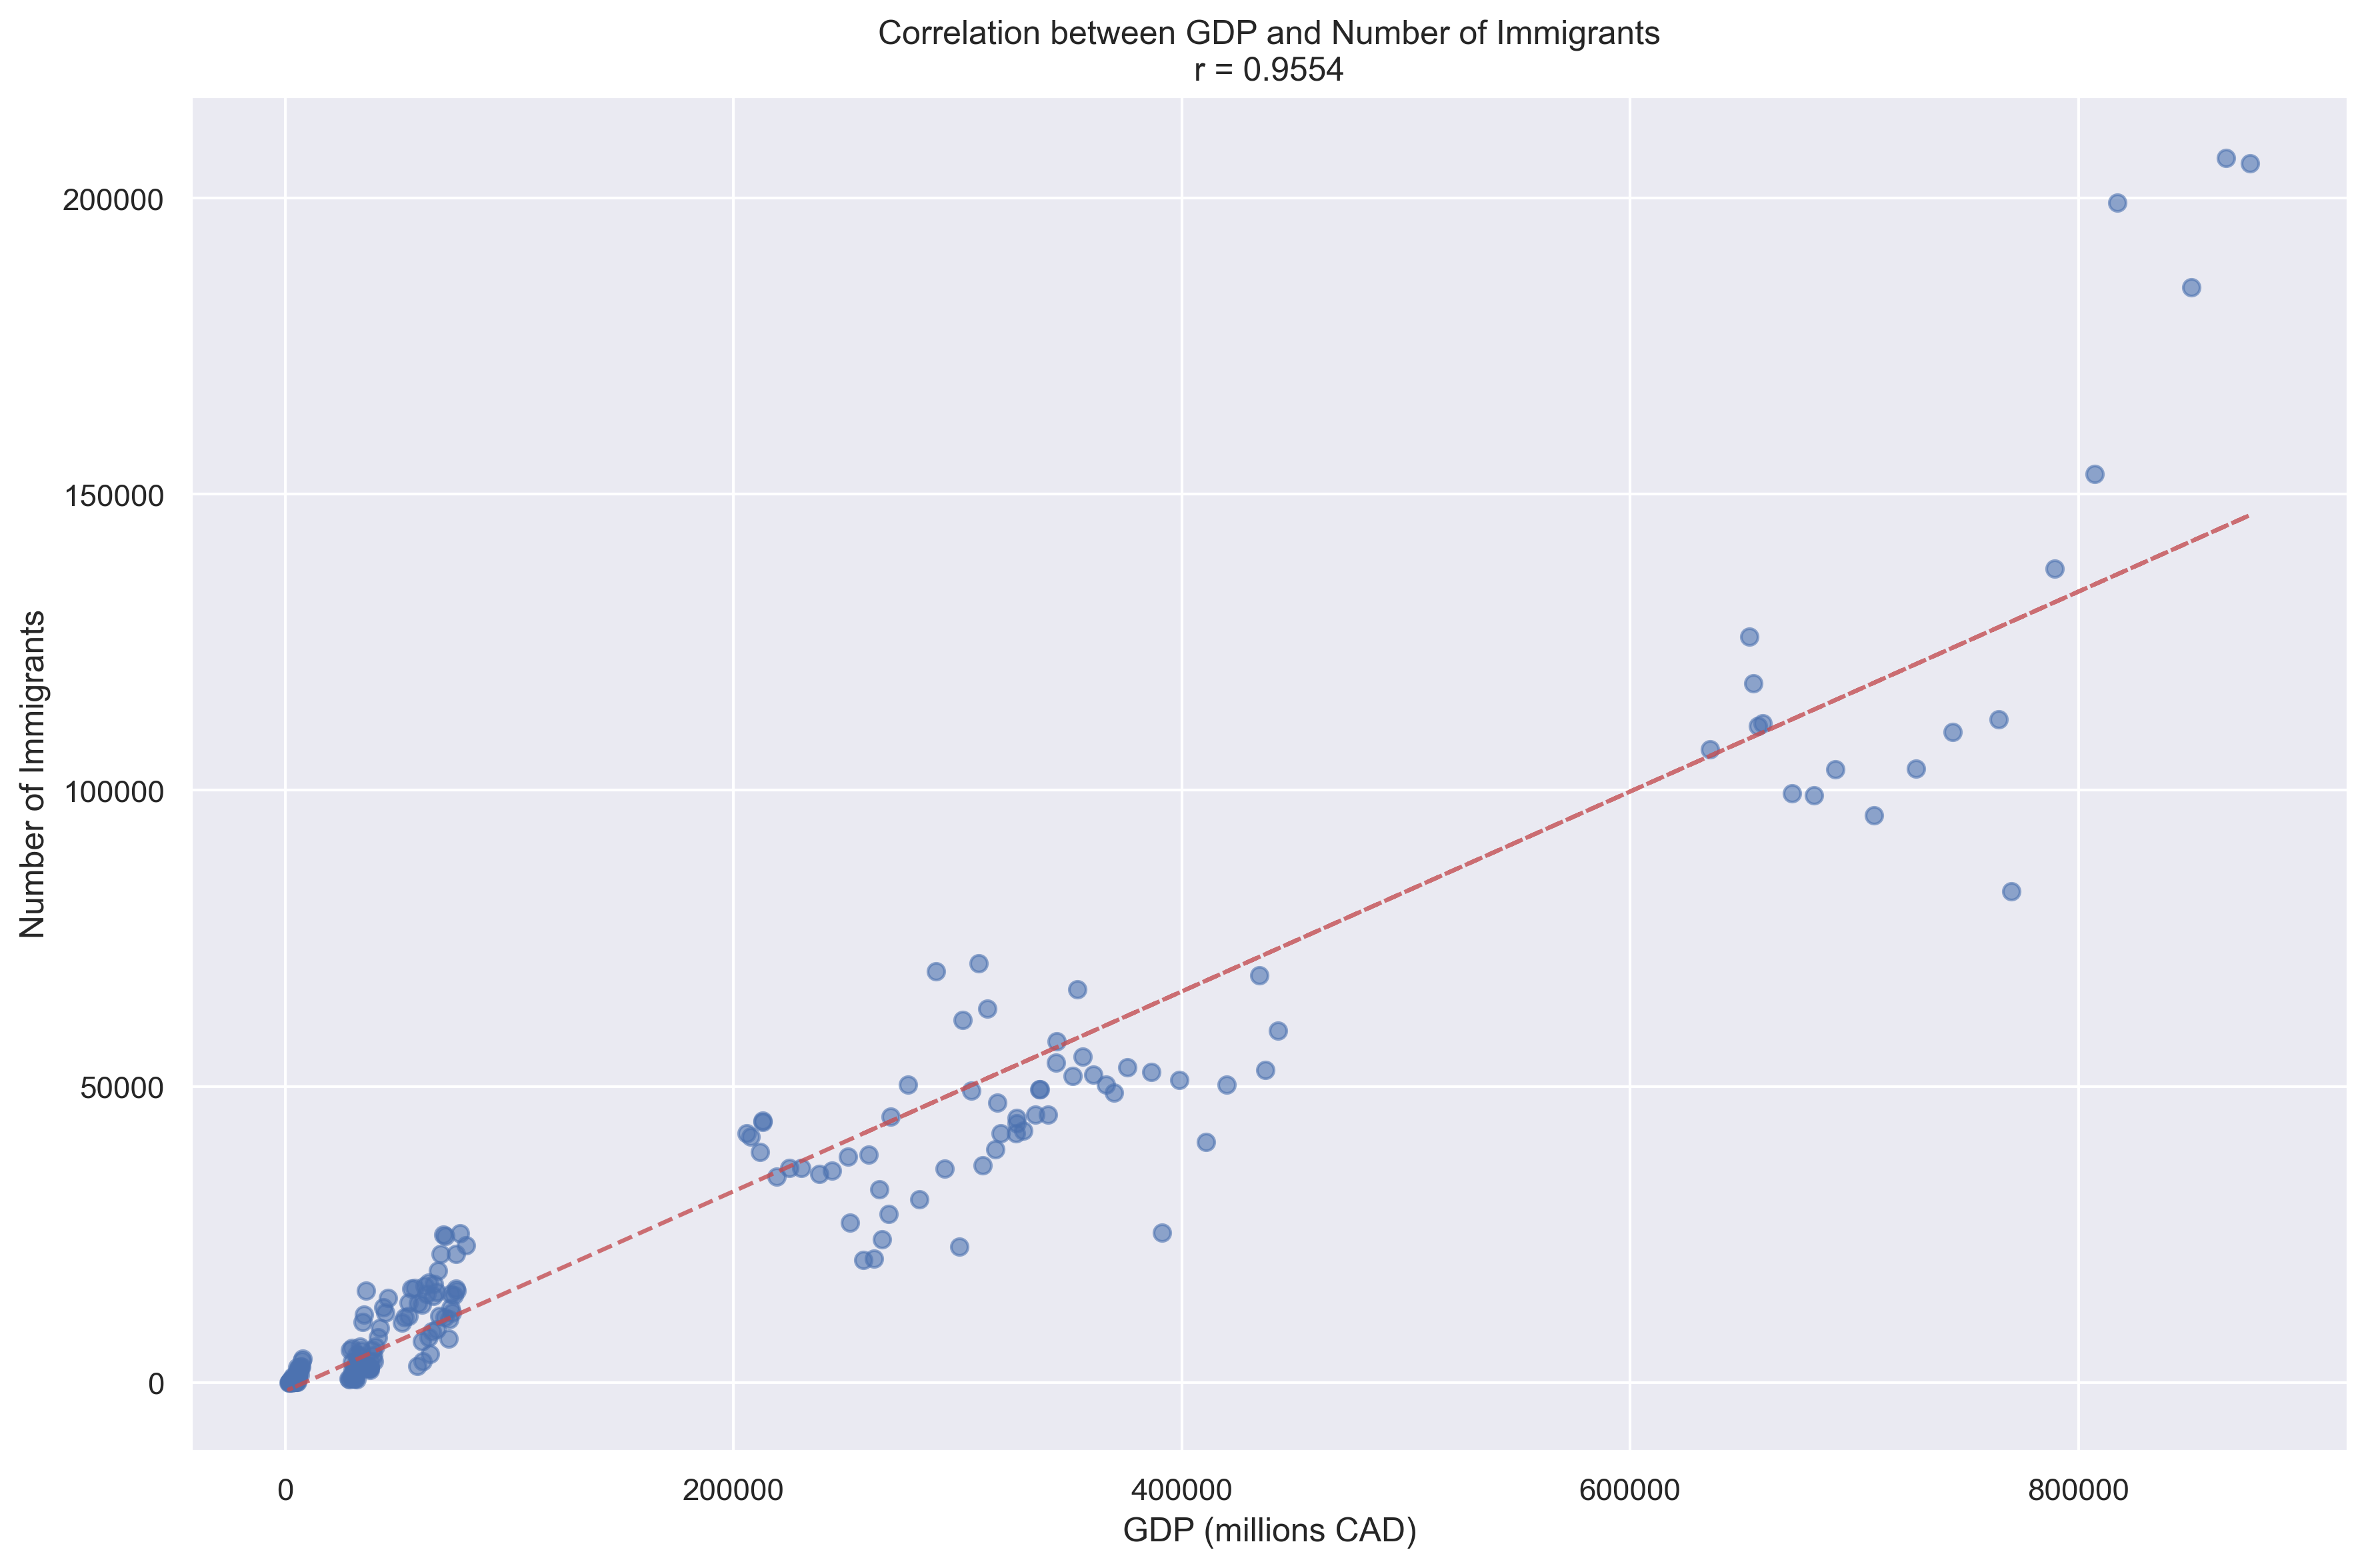
correlation coefficient: 0.9554
| Province | Correlation | P-value | N Years |
|---|---|---|---|
| Nova Scotia | 0.964 | 3.37e-11 | 19 |
| New Brunswick | 0.948 | 6.94e-10 | 19 |
| Alberta | 0.875 | 9.49e-07 | 19 |
| Saskatchewan | 0.872 | 1.15e-06 | 19 |
| Yukon | 0.829 | 1.16e-05 | 19 |
| Prince Edward Island | 0.810 | 2.64e-05 | 19 |
| Ontario | 0.790 | 5.66e-05 | 19 |
| Manitoba | 0.723 | 4.73e-04 | 19 |
| British Columbia | 0.710 | 6.61e-04 | 19 |
| Nunavut | 0.699 | 8.74e-04 | 19 |
| Quebec | 0.284 | 2.38e-01 | 19 |
| Newfoundland and Labrador | -0.276 | 2.52e-01 | 19 |
| Northwest Territories | -0.329 | 1.69e-01 | 19 |
- Strong positive correlations (>0.7) found in 9 provinces
- Weak/negative correlations in Quebec, Newfoundland and Labrador, and Northwest Territories
- All significant correlations have p-values < 0.001
All provinces have declining trends in retention rates, which means immigrant mobility after landing has been increasing. However, we can see differences in declining slopes between provinces. Ontario, Alberta, BC, and Quebec still have over 80% retention rates on average between 2012 and 2022. The number of immigrants has a correlation with provincial GDP. Not all individual provinces have strong correlations, but 9 provinces show strong positive correlations. Therefore, we can assume large provinces have the capability to retain immigrants, while small and rural provinces have fewer immigrants and also show a greater tendency for people to plan moves after landing.
3.3 Correlation between immigrants and housing prices in Canada
- dataset:
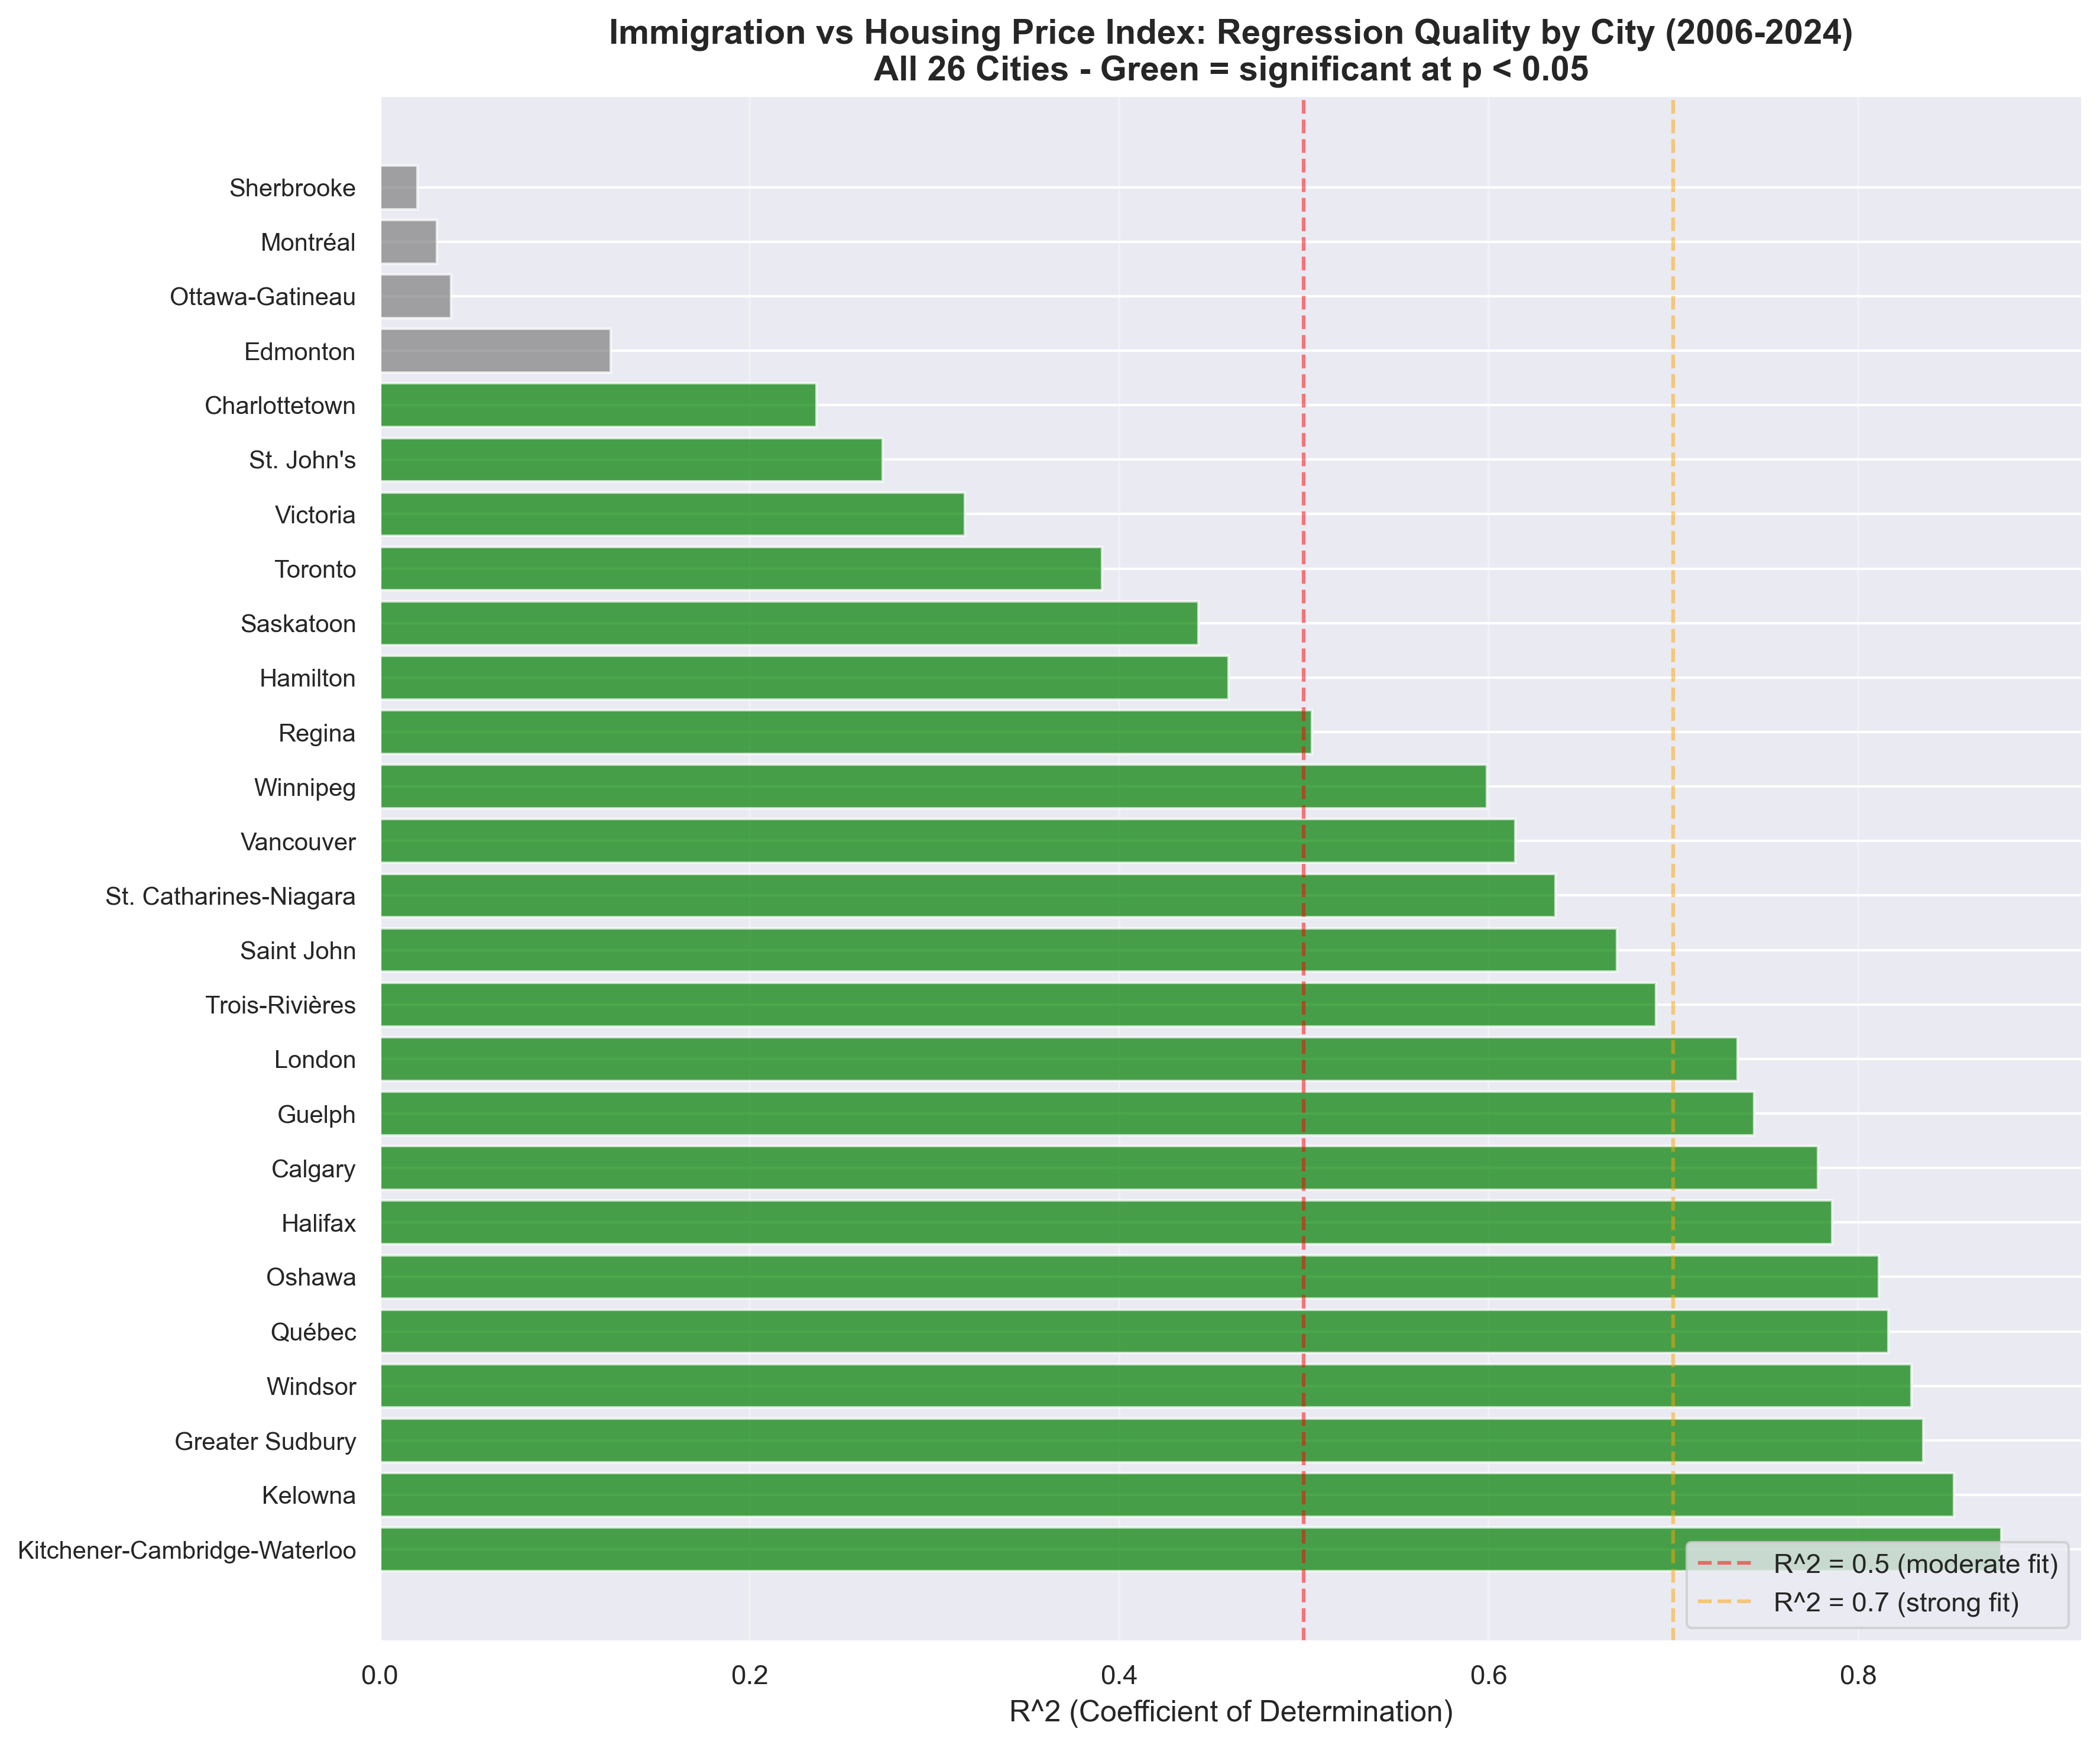
data/processed/hpi_yearly.csv,data/processed/immigrants_by_cities.csv - Cities analyzed: 26 (HPI has 26 major cities, immigrant data has larger though)
- Significant relationships (p < 0.05): 22
- Strong fits (R^2 > 0.7): 10
- Moderate fits (0.5 < R^2 <= 0.7): 6
- Weak fits (R^2 <= 0.5): 10
The graph clearly shows which cities have strong correlations between immigration and housing prices, with Kitchener-Cambridge-Waterloo, Kelowna, Greater Sudbury, and Windsor showing the strongest relationships.
3.4 Important Features of real estate prices
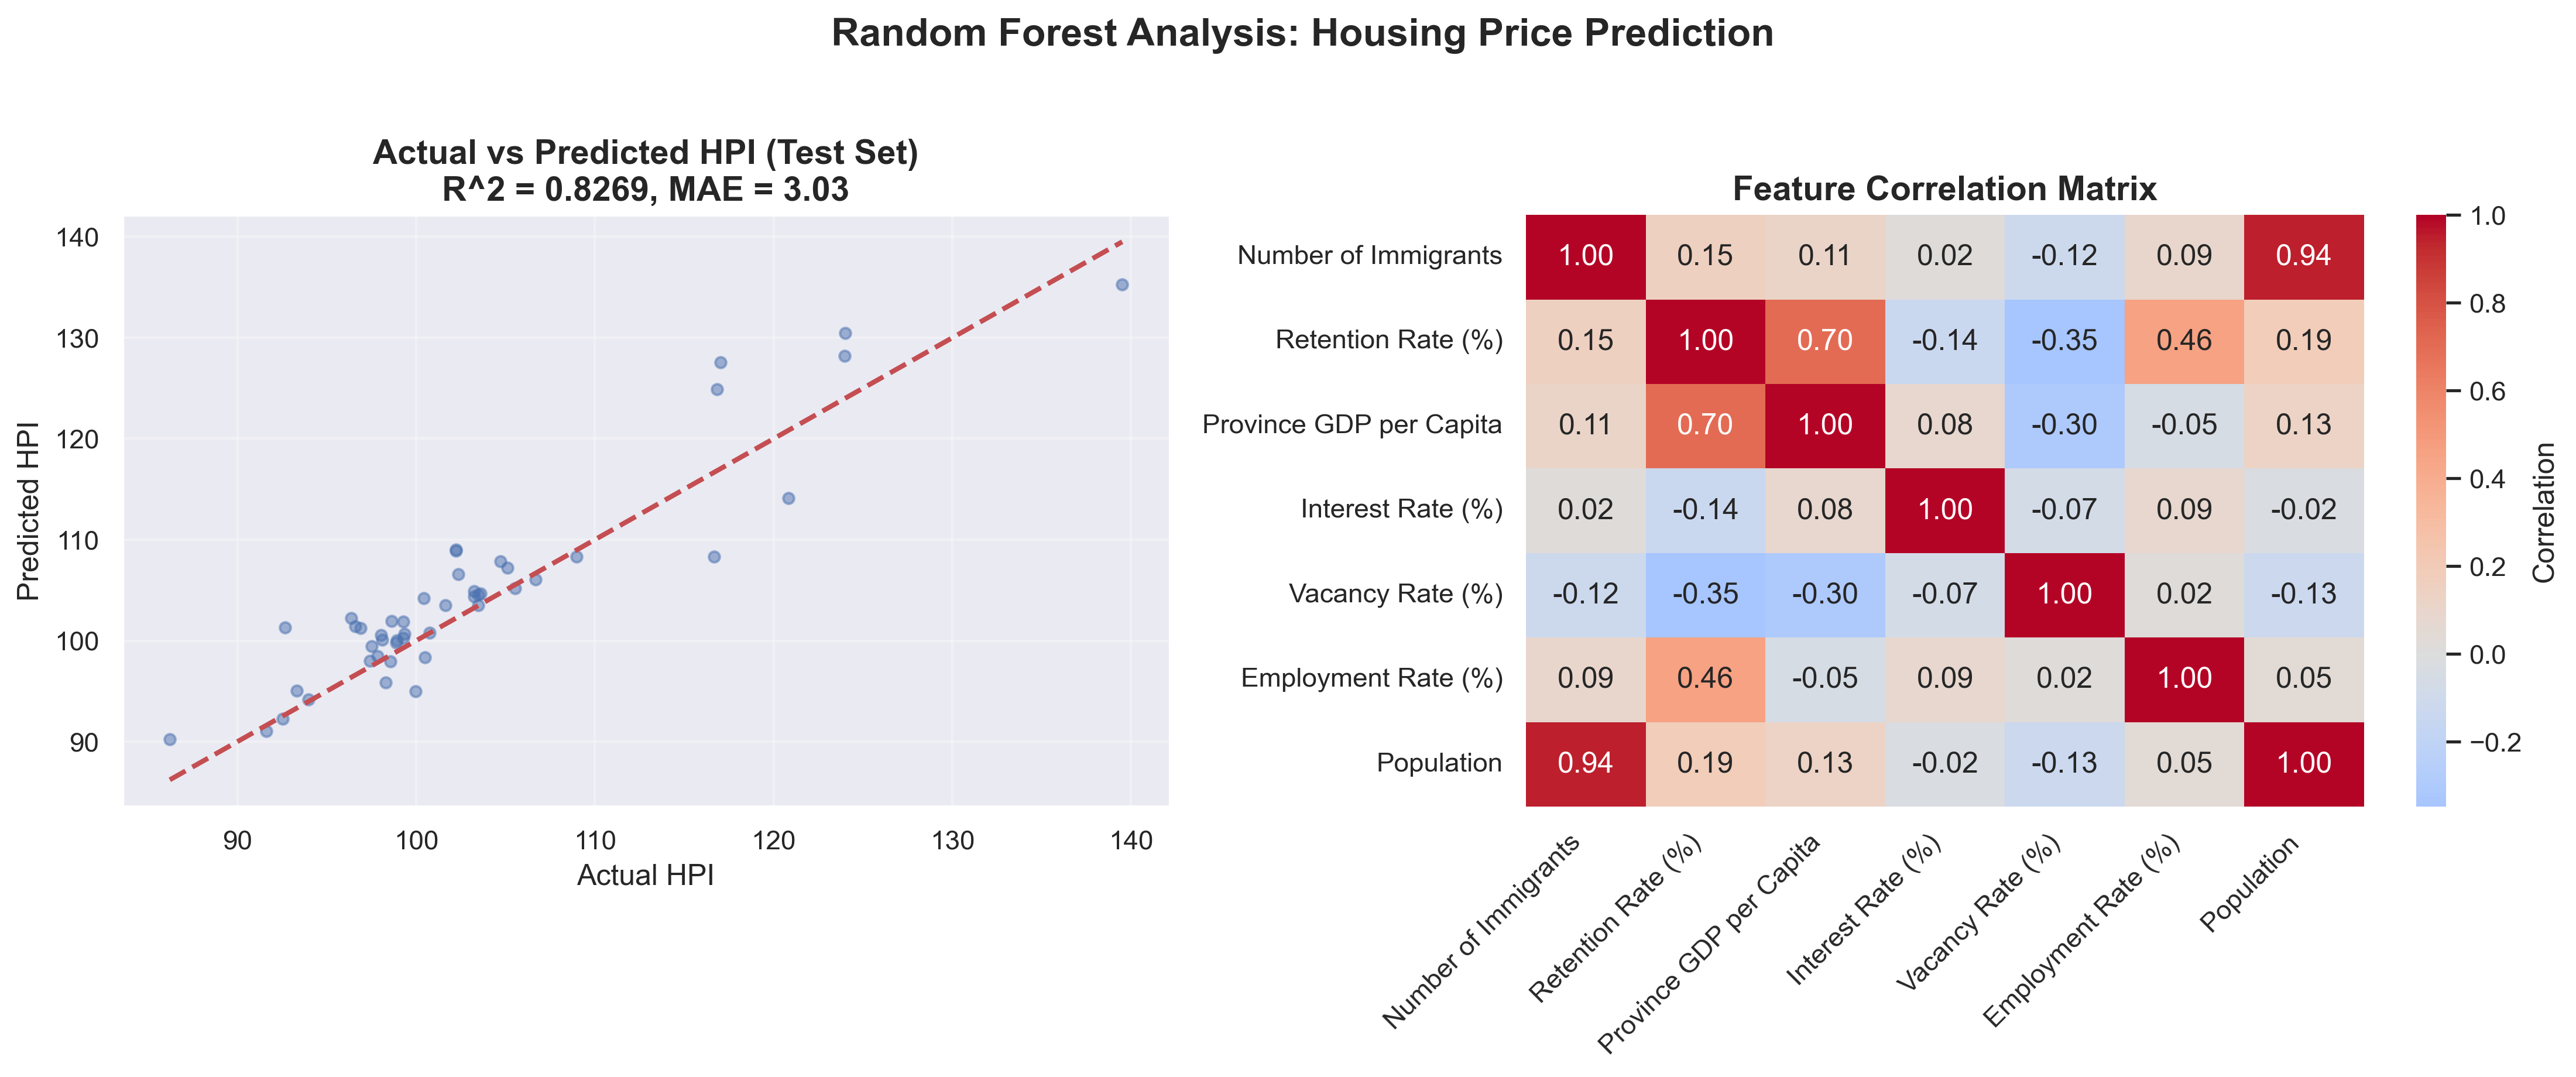
Model Performance
Training R^2: 0.8948 Testing R^2: 0.8269 Testing MAE: 3.03 Testing RMSE: 4.02 Cross-validation R^2 (mean +- std): -2.7461 +- 1.4248
Feature Importance Ranking:
- Province GDP per Capita: 0.4307
- Retention Rate (%): 0.1792
- Population: 0.1158
- Interest Rate: 0.0943
- Number of Immigrants: 0.0740
- Vacancy Rate (%): 0.0689
- Employment Rate (%): 0.0373
Important features of real estate prices show that the number of immigrants is not a major factor. Comparing the immigrant-HPI correlation, we can see that correlation does not mean immigration is a causal factor. Rather, immigrants tend to move to large cities, even though housing prices in economically wealthy areas are higher.
3.5 Clustering Cities in Canada
4. Conclusion and Limitations
4.1 Findings
Immigration has a different meaning compared to normal population increase. Because immigrants usually come as adults with children, they are also looking for new places to live. This means they tend to seek “better” places to live, which relates to the economic factors of cities and provinces.
Therefore, immigrants have a correlation with housing prices, but this does not appear to be a direct cause and effect. Rather, the population component changing from natural growth to immigrant growth accelerates urbanization, which increases housing prices.
4.2 Limitations
Time periods of data differ from each other, and immigration-related data has a relatively short timeframe. It would have been beneficial to compare pre-1990 immigration datasets, but most analysis had to be conducted based on post-2000 data.
There are countries in similar situations, such as Australia, New Zealand, and the US. Comparing policies between countries could help extend this analysis.
HPI does not represent rental prices. I strongly suspect rental prices correlate with housing prices and non-PR residents, but due to time constraints, I couldn’t find a way to filter different rental types to reflect this in the analysis.
There are not much dataset per cities. Province data is too much blended because canada is a geographically huge country.